Project Reports


|
Project Reports |


|
|
TestLog provides four types of report, Progress Reports, Status Reports, Test Case Reports and Test List Reports. Reports are generated on a Project basis and gather statistics from all test cases in all test suites in the currently active project. Reports are automatically deemed to span the duration of time from the Actual project start date, to the end date if past the end of the project, or else the date the report is generated on.
Progress Report
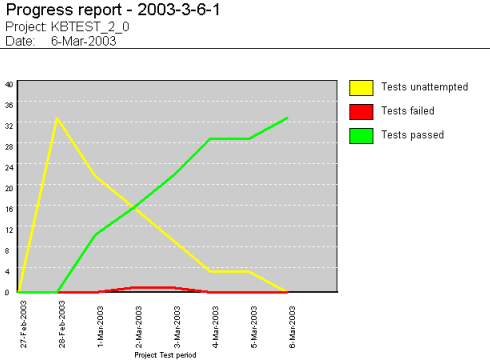
A progress report is a simple line chart showing the history of test case statuses. All test cases that currently exist in the project are taken into account. Test cases that were once part of the project, but have been subsequently deleted are not included. The y axis shows the number of test cases and the x axis shows the date. In this fashion the number of test cases in each of the three states Unattempted, Fail and Pass can be seen for each day of the project. Note that unless test cases are added or deleted the sum of the three statuses should remain the same. This means that as the number of test cases entering a pass or fail state rises, the number of test cases in the Unattempted state will drop accordingly.
 Progress report
For the report to be generated, the duration of the project needs to be broken into segments. If there isn’t any difference between the start and finish dates of the project then you will receive the error message “There is no time data to generate report. The finish date for the project is the same as or earlier than the start date.”. To fix this, right click on the project and select “Edit”, make sure the “Planned Start” or “Actual Start” date is earlier than the “Planned Finish” or “Actual Finish” date.
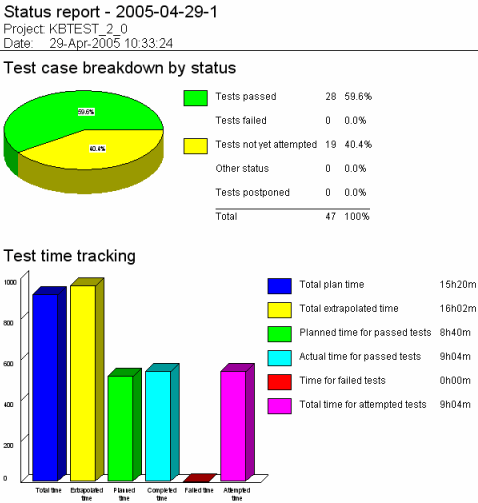
A Status Report provides a snapshot of the current state of the project. All test cases that currently exist in the project are taken into account for the purposes of generating the report. In the ‘Test case breakdown by status’ section, the report features a pie chart, which displays the proportion of test cases in the various states. On the right of the pie chart the legend shows the proportion along with the actual number of test cases in each state. The ‘Test time tracking’ section displays a bar chart, which provides some measurement of how accurately the project is keeping to its schedule.
‘Total plan time’ shows the amount of time scheduled to complete all tests in the project once.
‘Total extrapolated time’ is the estimated amount of time that will be required to carry out all tests based on the performance so far. So if the ‘Actual time for completed tests’ is greater than the ‘Planned time for completed tests’, the ‘Total extrapolated time’ will be proportionately greater than the ‘Total plan time’.
‘Planned time for passed tests’ shows the amount of time scheduled to complete all tests that have currently been passed.
‘Actual time for passed tests’ shows the total actual duration to carry out the passed tests once. This value is only a sum of tests, which have been attempted at least once and are now in the pass state. If a test has been attempted more than once, the length of time it last took to carry out the test will be taken. If a test is in a passed state and the actual duration is set to 0 the expected duration will be used.
‘Time for failed tests’ is the total actual duration of all tests in a failed state. If a test is in a failed state and the actual duration is set to 0 the expected duration will be used.
‘Total time for attempted tests’ is the total actual time of all tests in an attempted state, such as other or postponed, and that have been attempted at least once plus the actual time for passed tests and the time for failed tests.
 Status report
Finally the bottom of the Report displays some overall averages in the ‘Test plan statistics’ section. The ‘Average actual time per test attempted’ and ‘Average expected time per test planned’ values are self explanatory. The ‘Percentage of time used’ shows the percentage of the ‘Total plan time’ to the ‘Actual time for completed tests’
Test Case Report
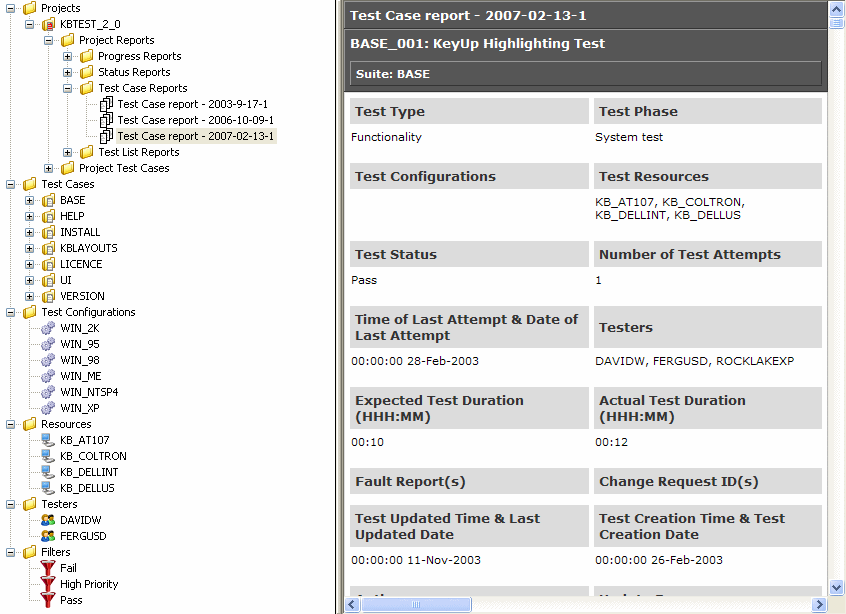
A Test Case Report provides a way of collecting the details of project test cases matching a certain filter, or when no filter is selected all the test cases of the selected project, into one file. Each test case ID will be underlined and colored red and the data from each test case will be below the ID, under the headings used when displaying a project test case.
 Part of a Test Case Report
Test List Report
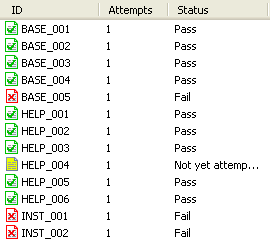
A Test List Report creates a list of test cases matching a certain filter, or when ‘--No Filter--’ is selected a list of all the test cases in the selected project. When generating the report there is the option of selecting which columns to include, these are the columns corresponding to the ones shown in the List View when a project test suite is selected. By default all the columns are selected and to generate the report at least one column must be selected.
 Part of a Test List Report created using the columns ‘ID’, ‘Attempts’ and ‘Status’ |